I wanted a tool to measure the thawing potential that weather exerts on lakes in spring so my friends, colleagues, and family could better plan for spring activities. So I made a fun widget called the Minnesota Lake Ice-In and Ice-Out Widget to help track thawing in spring.
About the time people start packing for a winter vacation in southern climes, my mind turns to ice-out and when I can put my boat in the lake. I know that I am not alone. Those hours out on the lake are magical and our northern Minnesota lakes are some of the best in the world. I know – I’m a limnologist. When I was a kid in Minnesota, my family never thought about going to the lake before Memorial Day, and, although some years the lakes were clear of ice a bit early, ice-out in Itasca County was always around May Day, plus or minus a few days. Now, due to climate weirdness, ice-out in the northern half of the state can be anytime between March 25 and May 15. That’s a span of 52 days or seven weeks!
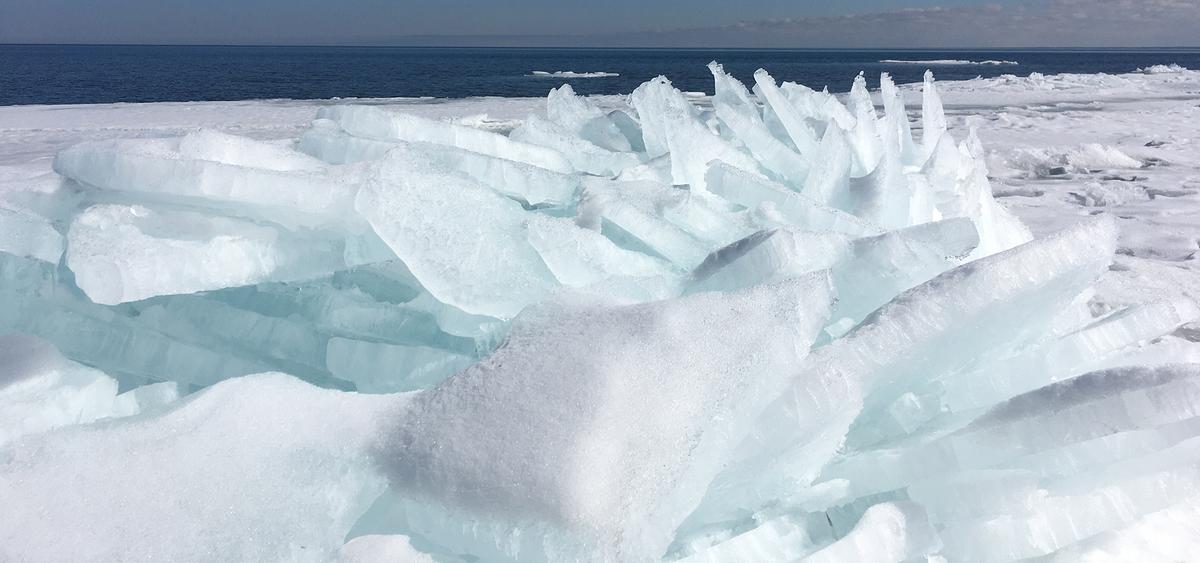
Hummocked or piled plates or sheets of ice along the shore of Lake Superior. Image credit: M. Thoms/MNSG
The ice-out bell curve.
When will the ice leave Northern Minnesota lakes? It’s a good question. In my February 2021 Director’s Column I explained how ice forms and how it thickens. Here I want to help us understand and predict when the lakes will be free of ice. I bet you’ve thought about this. When ice-out can be plus or minus seven weeks, that’s a lot of variation. Normally, we think of the warm summer season as 12 weeks long in Minnesota. Open water for seven more weeks means a “summer” that is 50% longer. More boating and swimming (brrr). Resorts and cabins can be open earlier and running longer. Better predictability means we can plan and take advantage of early open water when it happens.

Ice on lakes thaws at different rates in different years, depending upon the weather. The figure above shows the day number (from January 1) on which popular lakes in northern Minnesota lose their ice from some of the earliest records to the most recent. The data come from the Minnesota Department of Natural Resources Minnesota Lake Ice Out Dates website that receives data from local professionals, lake associations, and others. The average ice-out date for lakes in the northern half of Minnesota is April 24 but has been as early as late March and as late as mid-May. So, if we want to guess when ice might leave the lakes, it’s useful to track the weather especially those aspects of weather that take out lake ice.
The shape of a season
There are several things that determine when the lakes will be free of ice. Ice melts fastest when:
- Weather is warm
- Ice is thin
- Snow cover is low
- Winds are high
Among the most important factors is the amount of accumulated heat that occurs as spring arrives. Meteorologists measure the power of weather to melt ice as cumulative “thawing degree days” (TDDs). This is a funny term because it mentions temperature and time. That makes sense. If you take an ice cube out of the freezer for five minutes, it will still be pretty frozen when you put it back in. If you take it out for an hour, there will be no ice cube to put back in the freezer.
Thawing degree days (TDDs) is a measure of accumulated springtime heat. If the air temperature is an average of 10 degrees F above freezing during a day, this accumulates 10 thawing degree days. If the air temperature is an average of 15 degrees F above freezing the next day, this accumulates another 15 thawing degree days for a total of 25 thawing degree days for that two-day period. If the temperature averages below freezing for a day or two, that doesn’t add any more thawing degree days because thawing is not happening during that time. The faster that thawing degree days (TDDs) accumulate in the spring, the faster the ice in lakes melts.
Generally, in the northern half of Minnesota, it takes an average of about 220 thawing degree days (TDDs) to melt lake ice. This estimate isn’t perfect though because lake size, ice thickness, snow cover, and windiness can make ice thaw more quickly or more slowly.

The graph above shows how heat accumulated in spring over the last 40 years or so for one weather station close to the northern Minnesota lakes. I put the “y” axis in a logarithmic scale so you can more clearly see the accumulation of heat as spring approaches. What you see in this graph is that winter-to-spring heating has started much earlier or later in particular years.
Notice that thawing degree days (TDDs) can start as early as early February in some years or as late as early April in others. Weather needs to be warming in order to melt the ice off of lakes. This graph shows that in Minnesota warming can start over the span of about two months, depending on the weather.
I always hope for a mid-winter thaw to portend early ice-out. However, a thaw doesn’t really count toward thawing if the average of the high and low temperatures during the day isn’t above 32 degrees F because the net effect of daytime heat won’t translate to a net melting of ice.
The green horizontal line on the graph is the average amount of cumulative heat needed in spring to melt ice from lakes in this region. I will explain this later but notice that in Minnesota heat is great enough in spring to melt lakes late in March to almost mid-May. Note the spread of lines where the green line crosses all the seasonal data.
Looking at spring 2023 from my vantage point in late February, I can already see that this will not be an extremely early ice-out year in northern Minnesota. Why? Although it is not impossible that weather would heat up rapidly and take out the ice, the longer we proceed with days with average temperatures below freezing (thawing degree days = 0), the longer it will take for ice to leave the lakes. Looking at the graph shows that in the warmest years when ice-out had been in late March or early April, the season had already started to warm by the beginning of March.
How much warm weather to melt lakes?
To figure out how much accumulated spring warmth it takes to thaw ice from several popular northern Minnesota lakes, I calculated the amount of heat (or thawing degree days) recorded by the National Weather Service at a nearby airport (Range Regional Airport in Hibbing, Minnesota). Then, I looked at what scientists call a cumulative probability curve, which is shown in the graph below.

For the Range Regional Airport in Hibbing, Minnesota, figure 3 shows that for the past 40 years or so there have been about 220 TDDs, when about half of the lakes are free of ice. If the weather records from an airport near a lake you’re interested in show 220 TDDs since January 1, the chances are 50:50 that the lake ice is out. The higher the number of TDDs on a given date, the greater the chances that a lake has no ice. When cumulative TDDs approaches 300, the chances are only 1 in 10 that there is still ice on the lake. So, if you could monitor or predict cumulative TDDs in the springtime, you could make an educated guess at when lakes would lose their ice and, when you might be able to put your boat, dock, boatlift, and other lakey stuff in the water.
A new tool for tracking spring
I wanted a tool to measure the thawing potential that weather exerts on lakes in spring so my friends, colleagues, and family could better plan for spring activities. So I made a fun widget called the Minnesota Lake Ice-In and Ice-Out Widget to help us all track thawing in spring. The widget is a work in progress and I welcome your feedback. It’s relatively simple to use and we’ve included a “Geeky” section for those who like to play with data.
For the lakes in northern Minnesota, I found the weather data from the Range Regional Airport in Hibbing, Minnesota, the most useful for predicting ice-out.
Here’s how you can track thawing at your favorite lake
Using a few screenshots from our Minnesota Lake Ice-In and Ice-Out Widget, here's how to use the widget.
- On the widget map select the blue pin closest to the lake you’re interested in. Each blue pin represents an airport that generates and reports weather data to the National Weather Service.
- At the bottom of the map you’ll see text displaying the location you selected and years.

- Select the “Get Data” button.
- At the bottom of the map you’ll now see text displaying the cumulative number of Freezing Degree Days (FDDs) since October 1 and Thawing Degree Days (TDDs) since January 1 for the location and years you selected.

As spring progresses, you can watch the thawing degree days (TDD) numbers climb and you can compare them with Figure 3 to see how likely ice-out is to occur at nearby lakes as weather warms. If you want to calculate freezing or thawing degree days from other dates and years, you can play around with these in the “Geeky” section below the map.
Thanks to our web designer, Jane Reed, for turning my idea into an online tool that lets us make better guesses about when the boats and docks can go in the water! Thanks also to Warning Coordination Meteorologist Joe Moore, at the National Weather Service in Duluth, for helping me interface with NWS data.